Veterans United in
Philadelphia-Camden-Wilmington, PA
in the PA, NJ, DE, MD metro area
The Philadelphia housing market in October has weakened compared to last year with the median home price around $374,950 — down 2.6% from last year. Homes for sale in Philadelphia* now spend an average of 49 days on the market, and nearly 39% sell below asking price, giving buyers more negotiating power.
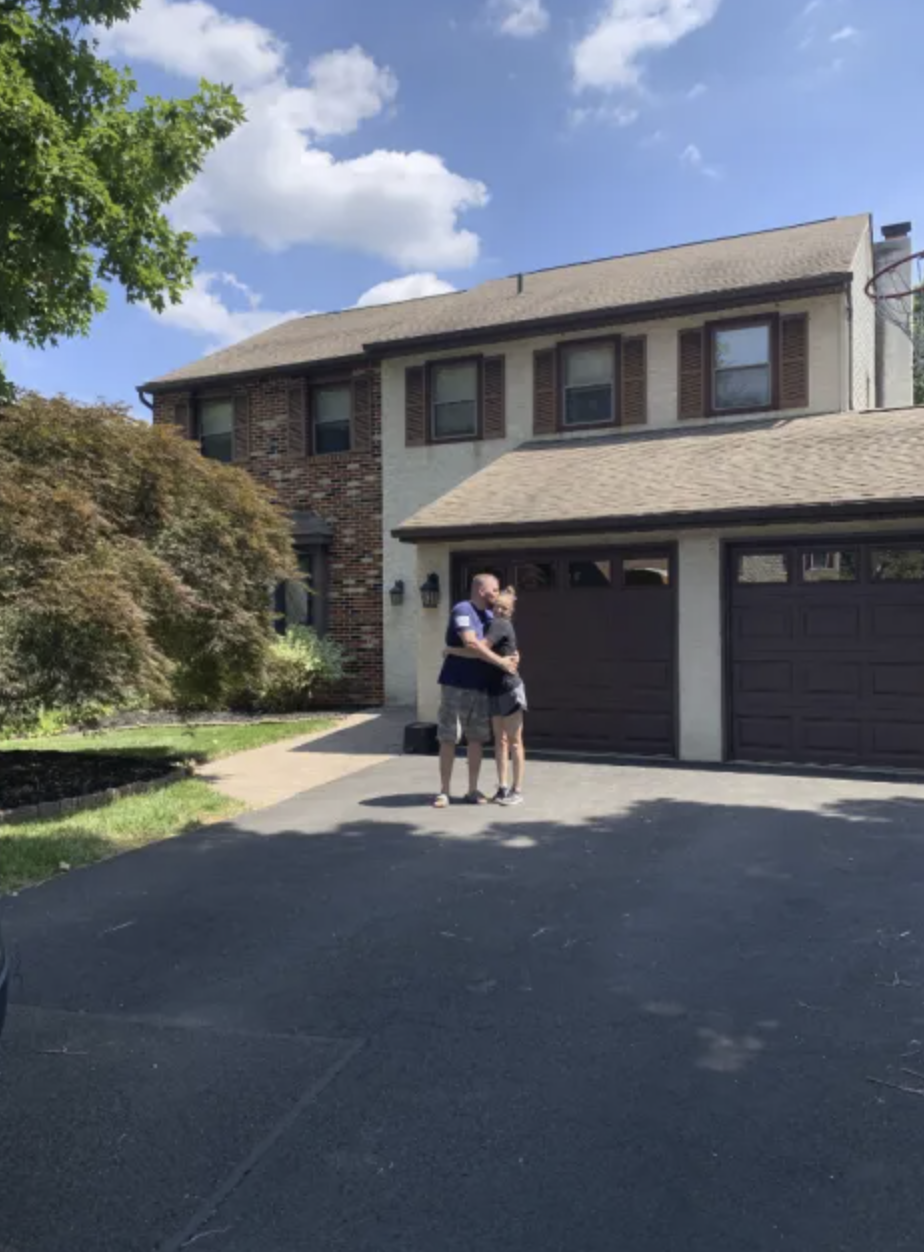
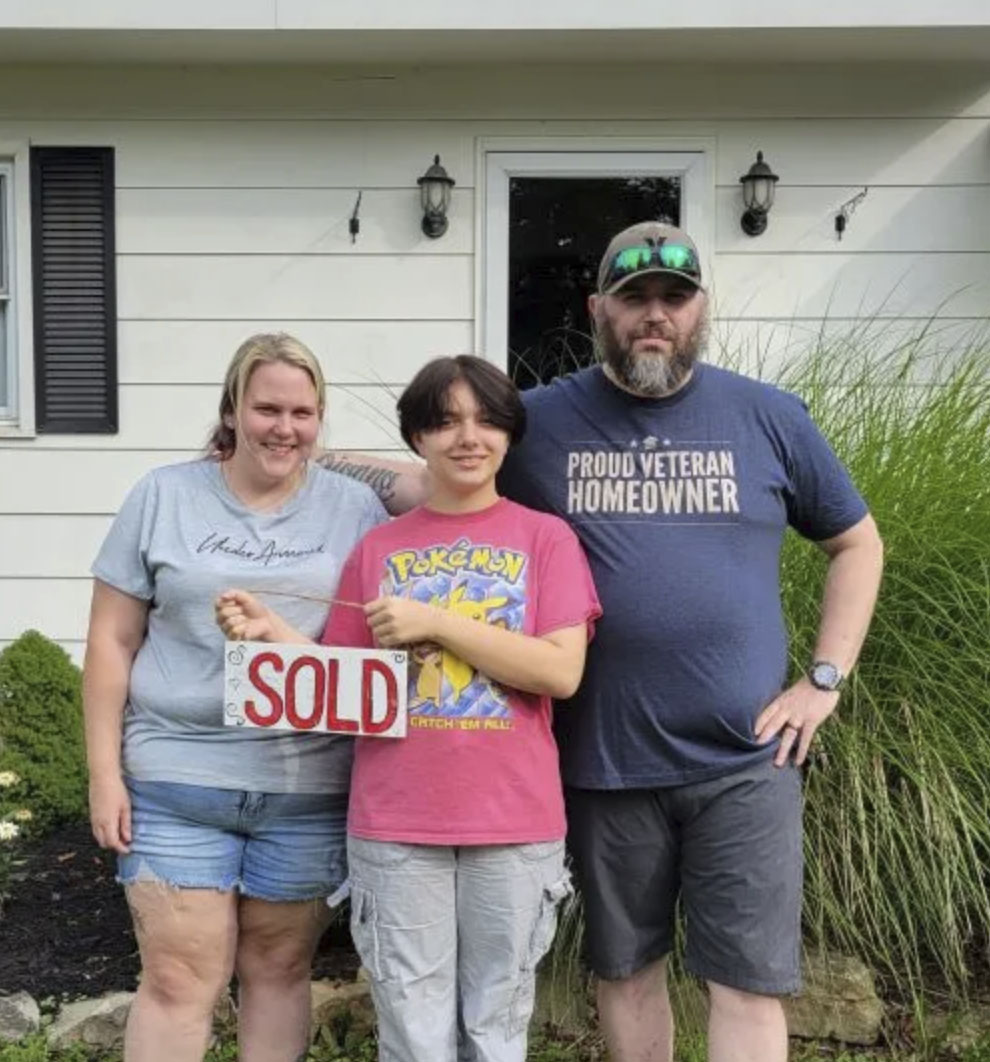
Just a few of the 840,100 Veterans we've helped get into homes.
6,753 Veterans in the Philadelphia-Camden-Wilmington, PA-NJ-DE-MD area alone!
Based on Veterans United and Veterans United Realty's internal data.
Brian W. | U.S. Marine Corps
Ronald B. | U.S. Army
David P. | U.S. Marine Corps
Donova B. | U.S. Army
Dormain V. | U.S. Navy
William E. | U.S. Army
Hames M. | U.S. Military
Philadelphia Metro Housing Market in October 2026
Median Days on Market
49 days
Homes are staying on the market 1.04% longer than last month.
Average Listing Price
$527,144
Average home prices are up 0.02% since last month.
Active Listings
13,756 homes
Number of houses on the market are up 5.36% since last month.
Homes in the Philadelphia region sell at a moderate pace.
39% of listings reduced price last month.
6,850
New listings
Up 9.8% from last month
13,756
Active listings
Up 5.4% from last month
VA Loan Market Share
3.5% of originations last year were VA loans.
951
Sold last year
1/29
Were VA loans
Philadelphia Area
Own vs Rent Trends
A higher share of owner-occupied homes often reflects stronger long-term ties to the community, since homeowners are more likely to stay in one place and invest in their neighborhoods. By contrast, areas with a larger renter population may be more transient, offering flexibility but sometimes less stability in housing markets.
It could also be an indication of market health, as affordable markets often have higher owner-occupancy rates.
The home listing price-to-income ratio in the Philadelphia area is 4.3
The ratio compares how expensive homes are in Philadelphia relative to household income. A higher ratio means homes cost more compared to what people earn.
A healthy price-to-income ratio is generally around 3 times your household's annual income (or less), but higher ratios can be sustainable depending on your rate, DTI, and more.
Median Home Prices by Neighborhood in the Philadelphia Region
This section breaks down median home prices by neighborhood. Use these insights to see where housing costs trend higher or lower, and to better understand the market at the zip code level.
The Philadelphia metro median income is $86,867.
Explore Philadelphia Area Neighborhoods
See how median home prices in individual Philadelphia neighborhoods compare to the overall metro median.
View this chart to learn about the median listing price and the number of active listings in Philadelphia over time.
Month
Nov 2022
Dec 2022
Jan 2023
Feb 2023
Mar 2023
Apr 2023
May 2023
Jun 2023
Jul 2023
Aug 2023
Sep 2023
Oct 2023
Nov 2023
Dec 2023
Jan 2024
Feb 2024
Mar 2024
Apr 2024
May 2024
Jun 2024
Jul 2024
Aug 2024
Sep 2024
Oct 2024
Nov 2024
Dec 2024
Jan 2025
Feb 2025
Mar 2025
Apr 2025
May 2025
Jun 2025
Jul 2025
Aug 2025
Sep 2025
Oct 2025
Nov 2025
Dec 2025
Jan 2026
Feb 2026
Mar 2026
Apr 2026
May 2026
Jun 2026
Jul 2026
Aug 2026
Sep 2026
Listing Price
$329,950
$320,000
$319,450
$322,450
$327,450
$339,200
$349,450
$354,950
$350,000
$350,000
$350,000
$350,000
$349,900
$340,000
$337,375
$339,950
$349,999
$369,950
$382,076
$395,000
$389,950
$382,000
$379,450
$376,500
$372,500
$358,075
$352,000
$350,000
$359,000
$375,000
$385,000
$387,450
$384,950
$380,000
$384,900
$379,973
$370,000
$359,950
$350,000
$356,425
$359,900
$372,450
$385,000
$389,900
$384,700
$374,900
$374,950
Month
Nov 2022
Dec 2022
Jan 2023
Feb 2023
Mar 2023
Apr 2023
May 2023
Jun 2023
Jul 2023
Aug 2023
Sep 2023
Oct 2023
Nov 2023
Dec 2023
Jan 2024
Feb 2024
Mar 2024
Apr 2024
May 2024
Jun 2024
Jul 2024
Aug 2024
Sep 2024
Oct 2024
Nov 2024
Dec 2024
Jan 2025
Feb 2025
Mar 2025
Apr 2025
May 2025
Jun 2025
Jul 2025
Aug 2025
Sep 2025
Oct 2025
Nov 2025
Dec 2025
Jan 2026
Feb 2026
Mar 2026
Apr 2026
May 2026
Jun 2026
Jul 2026
Aug 2026
Sep 2026
Active Listings
11,024
9,772
8,896
8,086
7,967
8,053
8,047
8,318
8,348
8,555
9,092
9,607
9,708
8,879
7,895
7,622
7,863
8,315
8,723
9,215
9,461
9,659
10,378
10,898
10,897
9,447
8,801
8,732
9,279
9,827
10,711
11,057
11,227
11,521
11,991
12,052
11,580
10,166
9,482
9,095
9,982
10,927
11,765
12,490
12,876
13,056
13,756
Median Days on Market
Days on Market
This chart shows the median days on market for active listings over time. In other words: how quickly homes move in the market. A declining rate means rising competition among buyers, while an increase means listings are sitting longer.
Month
Nov 2022
Dec 2022
Jan 2023
Feb 2023
Mar 2023
Apr 2023
May 2023
Jun 2023
Jul 2023
Aug 2023
Sep 2023
Oct 2023
Nov 2023
Dec 2023
Jan 2024
Feb 2024
Mar 2024
Apr 2024
May 2024
Jun 2024
Jul 2024
Aug 2024
Sep 2024
Oct 2024
Nov 2024
Dec 2024
Jan 2025
Feb 2025
Mar 2025
Apr 2025
May 2025
Jun 2025
Jul 2025
Aug 2025
Sep 2025
Oct 2025
Nov 2025
Dec 2025
Jan 2026
Feb 2026
Mar 2026
Apr 2026
May 2026
Jun 2026
Jul 2026
Aug 2026
Sep 2026
Median Days on Market
55
66
73
67
53
46
44
45
45
45
45
44
46
56
66
59
43
40
34
38
41
44
45
43
47
57
63
52
39
35
35
41
44
44
45
43
47
58
64
53
43
36
36
39
44
48
49
Market Hotness Score
Market Hotness
Based on Realtor.com's Market Hotness Index, this measure reflects how competitive the housing market is by comparing buyer demand with available inventory. Rising hotness scores point to more competition, while declining scores signal cooling conditions.
Month
Nov 2022
Dec 2022
Jan 2023
Feb 2023
Mar 2023
Apr 2023
May 2023
Jun 2023
Jul 2023
Aug 2023
Sep 2023
Oct 2023
Nov 2023
Dec 2023
Jan 2024
Feb 2024
Mar 2024
Apr 2024
May 2024
Jun 2024
Jul 2024
Aug 2024
Sep 2024
Oct 2024
Nov 2024
Dec 2024
Jan 2025
Feb 2025
Mar 2025
Apr 2025
May 2025
Jun 2025
Jul 2025
Aug 2025
Sep 2025
Oct 2025
Nov 2025
Dec 2025
Jan 2026
Feb 2026
Mar 2026
Apr 2026
May 2026
Jun 2026
Jul 2026
Aug 2026
Hotness Score
51.0033
54.0134
55.3512
45.3177
46.99
43.311
39.4649
39.4649
42.8094
47.8261
51.505
57.5251
62.5418
61.204
56.1873
52.8428
58.6957
58.3612
59.3645
56.5217
56.1873
62.3746
64.5485
73.2441
74.4147
72.7425
71.7391
70.903
75.2508
75.0836
74.5819
68.7291
70.2341
72.5753
74.0803
76.7559
76.087
76.4214
73.7458
70.4013
72.9097
76.2542
73.7458
71.9064
70.903
68.5619
Pending Homes-for-Sale %
Percentage of Homes Sold per Month
This chart shows the percentage of homes that sold each month, highlighting buyer demand and long-term market trends. In most markets, around 20% of listings selling each month is considered balanced. Higher percentages point to a strong sellers' market, while lower percentages indicate more favorable conditions for buyers.
Largest overall VA lender (purchase and refinance) for four consecutive years.
More VA purchase loans than any other lender for the past 10 consecutive years
Over the last six fiscal years, Veterans United made more VA purchase loans than USAA, Navy Federal Credit Union, Rocket Mortgage, Wells Fargo and Freedom Mortgage combined.
We have 1,022 Veterans ready to buy your home right now!
Most Veterans don't realize how little money it can take to buy a home. Many think it's out of reach, especially with lower approval amounts, but it's possible. Helping them understand options like seller concessions is one of the most rewarding parts of the job.
Paul D.Veterans United Network Realty Agent
In the Philadelphia market, VA buyers often see the most success on homes priced between $200,000 and $400,000, especially those that have been listed for 20 days or more. That's when you're more likely to negotiate and secure favorable terms.
Alexander S.Veterans United Network Realty Agent
In northeast Pennsylvania markets like Bushkill, Hawley, and Scranton/Wilkes-Barre, homes often receive multiple offers and can go under contract in just a day or two. VA buyers who are preapproved and prepared to act quickly are in the best position to compete.
Vernon W.Veterans United Network Realty Agent
1-800-985-5723 | 1512 Heriford Road, Columbia, MO 65202. Not affiliated with any government agency including the VA. Missouri Licensed Real Estate Brokerage; for license information, visit VeteransUnitedRealty.com. Equal Housing Opportunity.
Start Your VA Loan With Veterans United
Not sure where to begin? Whether you're stationed nearby or planning to move near Philadelphia, we’ll help you understand what to expect.
The "to do" list keeps you on track. All doc's are online, except closing. The process was stress free. VU was accessable, and responded quickly.
Angel P. | Marine Corps
Verified Customer
Very helpful and wonderful people to work with and guide you through everything.
Chad B. | Marine Corps
Verified Customer
Our team at Veterans United made purchasing our first home smooth and straightforward! The support, communication, and customer service exceeded our expectations! Thank you Veterans United!!
Brian W. | Marine Corps
Verified Customer
Everyone was fantastic and truly a pleasure to deal with. Very prompt and attentive to any questions or concerns I had.
Anthony S. | Army
Verified Customer
From the Barry, beginning of this process, everybody that was involved went above and beyond to help me secure my very first house to retire in. This includes follow up conversations on the weekend and every business day through the rest of the week until progress was made for me to sign the paperwo...
Dane S. | Army
Verified Customer
John and Kara were a great team to work with. Helped me with any questions or concerns.
Michael F. | Army
Verified Customer
Veterans united was a big help. Help me with everything I didn't know. We can't be any happier with our new home.
Donovan B. | Army
Verified Customer
Communication can laps a bit through the process, but if you’re diligent on your end, it’s a simple process.
Joel D. | Army
Verified Customer
The group was wonderful and walked me through everything. Being 79 they had to give me a lot of help and their patience was so great.
Linda P. | Army
Verified Customer
Jerry and his team were professional, friendly, attentive, and always prompt to respond to any questions or concerns I had. They navigated the VA appraisal process smoothly, communicated clearly through every Loan Estimate revision, and helped us close a full month ahead of schedule. They made the e...
Mack C. | Army
Verified Customer
Stephen and his team provided an outstanding home buying experience. This whole process can be overwhelming at times, but they were gracious and helpful every step of the way. The myvu portal provided a streamlined and organized access point for everything involved with the loan process. With a docu...
James M. |
Verified Customer
Rob and Olivia made this experience 10x better. They were very responsive, knowledgeable, and personable. There wasn’t anything I asked for that they did not see through. Based off my experience with them I would recommend VU 10x over! Thank you both for all of your hard-work and dedication on thi...
Renesha W. | Army
Verified Customer
Can’t speak highly enough of Kody and his entire service team. Everyone was extremely knowledgeable and accessible from pre approval through closing. Start to finish in 5 weeks! This is my 3rd time working with Veterans United and if needed will 100% use again.
*Unless stated otherwise, data for the metro refers to the CBSA ("Core-Based Statistical Area"), the defined geography that makes up the surrounding metropolitan and micropolitan areas.
Enter to win $100,000 toward your new home!No purchase necessary; see official rules for details.
2026 New Home for the Holidays $100K Veteran Homebuyer Giveaway
1. realtor.com is hosting and helping to administer and promote the sweepstakes.
2. NMLS #1907 (nmlsconsumeraccess.org). Not affiliated with Dept. of Veterans Affairs or any government agency.
3. May be subject to tax withholding. See Official Rules for details.
Cookies and Related Technologies
Notice of Right to Opt-Out of Sale/Sharing
Your Privacy Choices
You can always choose to opt out of us sharing your name, email address, or other personal information with third parties for advertising purposes.
Cookies are small text files that store bits of information (such as usernames or preferences) to help recognize your device. We use cookies to keep our site running properly and to enhance your experience.
You can manage your cookie preferences at any time, including turning off advertising cookies. Please note that disabling some cookies may impact your experience on the site. Essential cookies, which are necessary for basic site functions, cannot be turned off.